 SimpleTrade
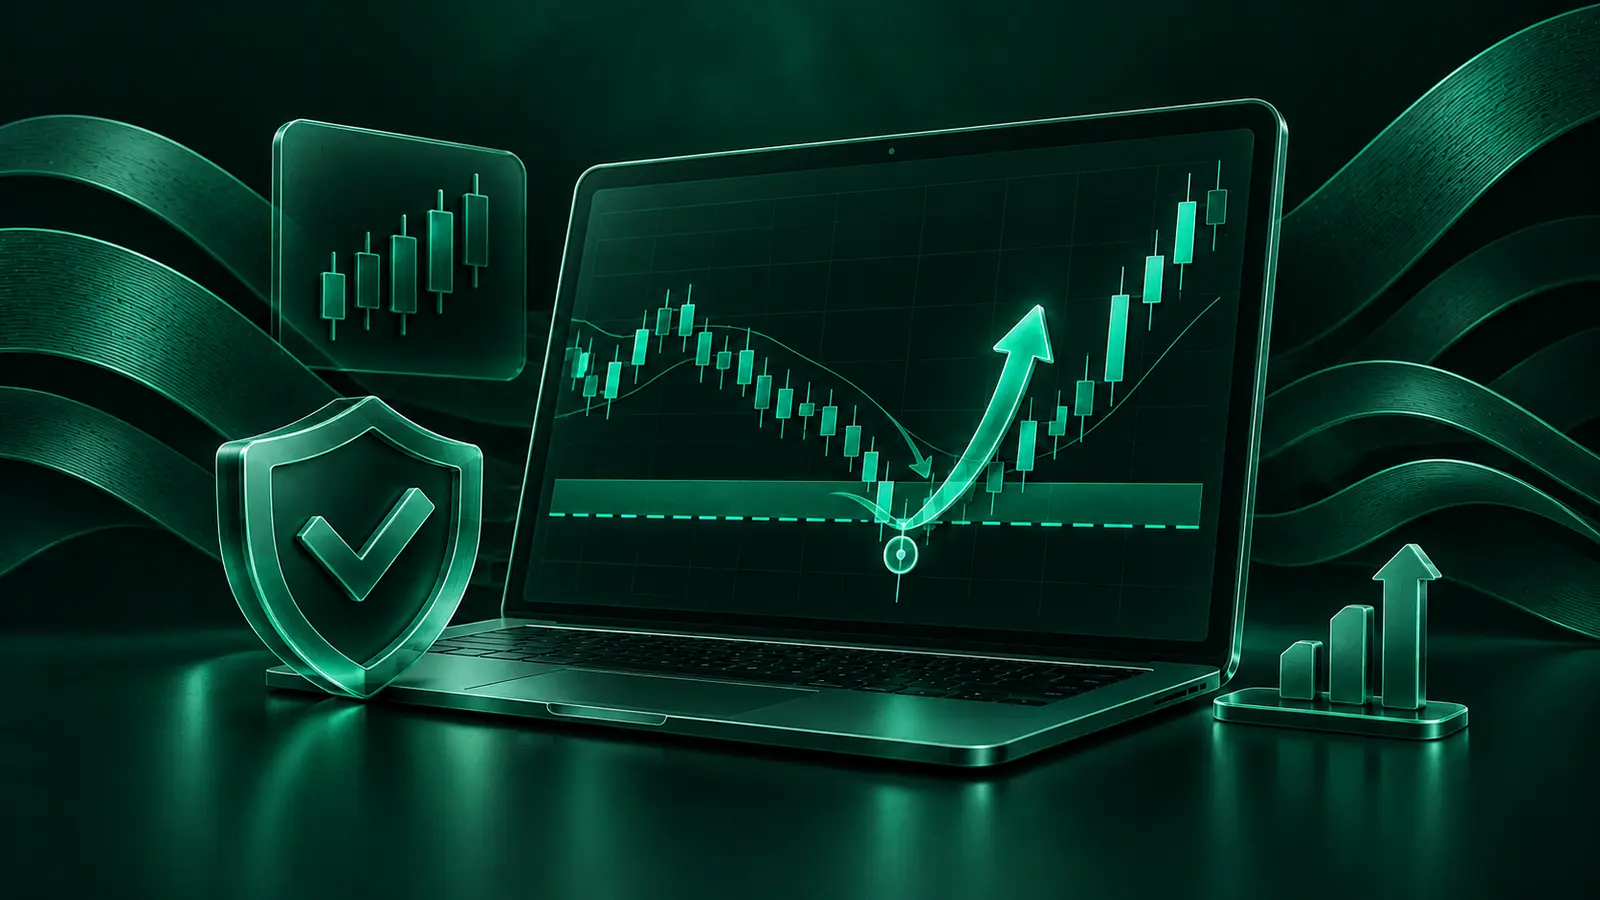
Why Does Price Hit Your Stop-Loss and Then Reverse?
Why Does Price Hit Your Stop-Loss and Then Reverse?
Imagine this: you open a LONG position, set your stop-loss, and expect the price to move higher.
Instead, the market drops slightly, triggers your stop-loss, and closes your position at a loss. Just a few minutes later, the price reverses and starts moving exactly in the direction you originally predicted.
Sound familiar?
Many traders believe the market is deliberately hunting their stop-loss orders. In reality, these movements are often related to liquidity, order placement, and the behavior of market participants.
Let's break down why this happens, what a liquidity sweep is, and how to account for these movements when trading.
Why Does Price Often Reverse Near Stop-Loss Levels?
First, we need to understand liquidity.
Liquidity refers to how easily an asset can be bought or sold without significantly affecting its price.
In cryptocurrency markets, large numbers of orders often accumulate around specific price levels:
- Previous highs and lows.
- Support and resistance levels.
- Round-number price levels.
- The upper and lower boundaries of trading ranges.
Why do these areas attract so many orders?
Because many traders use similar technical analysis methods and place their protective orders around the same levels.
For example, if Bitcoin has repeatedly bounced from a particular support level, some traders will place their stop-loss orders just below it.
When the price reaches that area, those protective orders begin to trigger. Stop-market sell orders increase market selling activity, which can accelerate the downward movement.
However, if there is sufficient buying interest below the level, the price may quickly reverse.
This type of movement is often called a liquidity sweep. When the price breaks through a level but fails to remain beyond it, the move may also be described as a false breakout.
It's important to understand that not every such movement is caused by large market participants deliberately targeting stop-loss orders.
A Practical Trading Example
Let's say a trader opens a LONG position on BTC at 70,000 USDT.
The trader identifies support at 69,500 USDT and places a stop-loss slightly below it, at 69,450 USDT.
Here's what happens next:
01 / Bitcoin starts falling and breaks below the 69,500 USDT support level.
02 / The trader's stop-loss is triggered at 69,450 USDT.
03 / The price briefly drops to 69,400 USDT.
04 / Buyers push BTC back above the support level.
05 / Bitcoin continues rising and reaches 70,200 USDT.
The trader ends up with a losing position, even though the original prediction about the market's direction was correct.
This is a hypothetical example, but it illustrates an important principle:
Predicting the right price direction is not enough. Your entry point, stop-loss placement, and risk management are equally important.
During sharp price movements, the actual execution price of a stop-market order may also differ from the specified stop level.
How Can You Identify a False Breakout?
There is no single indicator that can reliably distinguish every false breakout from a genuine one.
However, several factors can help traders evaluate the situation.
01 / Price Returning to the Previous Range
During a false breakout, the price moves beyond a support or resistance level but quickly returns.
If the market holds beyond the broken level and continues moving in the same direction, it may indicate a more sustained breakout.
However, returning to the previous range does not automatically guarantee a reversal.
02 / Trading Volume
Volume reflects trading activity in the market.
A sudden increase in volume near an important level can accompany both genuine breakouts and movements that are followed by reversals.
That's why traders should evaluate not only the initial spike in activity but also how the price behaves afterward.
03 / Higher Timeframes
A trading signal may look convincing on a 15-minute chart, while the four-hour chart still shows a strong downtrend.
In this situation, a short-term increase could simply be a correction within the larger bearish trend.
Analyzing higher timeframes helps traders understand the broader market structure instead of making decisions based on a single signal.
Why Doesn't Widening Your Stop-Loss Always Help?
After several losing trades, some traders decide to move their stop-loss further away from the entry point.
The reasoning seems simple: a wider stop-loss is less likely to be triggered by a small price movement.
But this creates another problem.
The greater the distance to your stop-loss, the larger your potential loss becomes if your position size stays the same.
For example, with a position size of 1,000 USDT:
- A 1% adverse price movement represents approximately 10 USDT in losses.
- A 3% movement represents approximately 30 USDT in losses.
- A 5% movement represents approximately 50 USDT in losses.
These are simplified calculations that exclude trading fees and slippage.
Simply widening your stop-loss without adjusting your position size can significantly increase your risk.
A more structured approach is to place protective orders based on market conditions while keeping potential losses within acceptable limits.
How Can You Reduce Premature Stop-Loss Triggers?
False breakouts cannot be eliminated completely. However, several principles can help traders make more informed decisions.
01 / Consider Market Volatility
Different cryptocurrencies behave differently.
A 1% stop-loss might be appropriate for one asset but too tight for another, depending on its volatility and current market conditions.
02 / Analyze Market Structure
Your stop-loss should be connected to your trading strategy rather than based on an arbitrary percentage.
03 / Follow the Higher-Timeframe Trend
Short-term signals that go against the main market trend may require additional confirmation.
04 / Control Your Position Size
If your strategy requires a wider stop-loss, reducing your position size can help keep the potential loss within your risk limits.
05 / Avoid Rushing Into Trades
A large bullish or bearish candle doesn't necessarily indicate the beginning of a sustained move.
Sometimes waiting for additional confirmation is more useful than entering immediately.
Most importantly, don't abandon stop-loss orders just because they occasionally trigger before a reversal. Managing potential losses remains one of the most important parts of any trading system.
How Does SimpleTrade TradingOS Help?
SimpleTrade TradingOS provides additional settings that allow users to customize automated trading and signal selection.
EMA50/EMA200 Trend Filter
This filter helps account for the current trend direction when opening trades.
Users can choose to trade with the trend, against the trend, or in both directions.
Higher Timeframe Filter
This feature adds broader market context to the signal selection process.
For example, before opening a position on a lower timeframe, the bot can take the direction of a higher timeframe into account.
Volume Confirmation
Trading volume can be used as an additional condition when selecting signals.
This allows users to apply a more selective approach to trade entries.
Stop Loss and Take Profit
Users can configure their own position-closing parameters and define acceptable risk levels.
Trailing Stop
The trailing-stop feature allows the protective level to move automatically as the price moves favorably, according to the selected settings.
Maximum Open Positions
Users can limit the number of simultaneously open positions to manage trading exposure and the load on their account balance.
These tools cannot eliminate losing trades, but they can help traders build a more consistent and structured trading approach.
Can You Test a Strategy Without Risking Your Own Capital?
Yes.
SimpleTrade TradingOS offers a DEMO account with a virtual balance of 10,000 USDT.
Users can explore the trading terminal, test the signal bot, and see how different settings affect trading activity.
This is particularly useful for beginners learning about automated trading or traders who want to test a new strategy before using real funds.
Key Takeaways
If your stop-loss gets triggered and the price immediately reverses, it doesn't necessarily mean your market analysis was wrong or that someone deliberately targeted your trade.
Cryptocurrency markets constantly interact with areas of concentrated liquidity. Temporary breakouts, sharp price movements, and quick reversals are all part of normal market behavior.
A trader's goal is not to avoid every stop-loss, but to control risk and evaluate strategy performance over a meaningful period.
With SimpleTrade TradingOS, users can customize trading parameters, enable additional signal filters, and test different strategies.